qas30

--== It is Not Random But Designs ==--
Having trading discipline is the beginning; keeping discipline is the progress;
staying discipline is the success

Gold Trade Archieves

Published on: Senin, 17 Februari 2014 in , ,


Following W1TF  analysis,...when the they make a curve..PA can break 36 area now, LR_TSF are still hugging, gonna be higher move forward to 72 level area..i can closed it manually or let it run..i will control D1 TF as my long term trade correction area.

No Funda at all thi is just a Technical Trade analysis.


Should We Trade More than a Pair...??

Published on: Jumat, 07 Februari 2014 in , ,
If someone should concentrate on one currency pair in their forex trading is a fundamental question that needs to be addressed and matched to your trading style before you are going to be successful. My gut feeling is that the shorter the timeframe you use on your charts to make trade decisions, the lower the number of pairs you should trade. Let's get into the details:

You can be successful trading one pair

Many Traders are successful trading just one pair. The advantages of trading one pair include getting to know how one currency pair moves better, less to concentrate on when trading, which in turn leads to less distraction. One great example of a trader who is successful trading only the GBP/JPY is NickB at the Forex 4 Noobs website. By only trading the GBP/JPY using his scalping strategy, he has averaged over 100 pips profit every week for a year. I really like his site and love to use his trading for newbies as a simplistic approach to becoming successful.

Many traders do not like to trade one pair because their trading style doesn't get them into trades as frequently enough as they would like and they feel like they are missing out on the action. I call these people over traders and most of them will not be successful at all in the long run. I personally like to only trade one pair when I am trading with my 1 minute scalp system that I am develping right now. It moves to fast to look at too many charts at once.

You can be successful trading multiple pairs

My major trading style is one that only presents trades at most 5-12 times per week. Considering the low frequency at which this trades, I can successfully monitor all of the major pairs and many of the crosses at one time to look for the best entries and highest probabilities for what I think will be great trades. I don't trade all of these pairs at once because I am impatient. I merely can do this, and I have test my success to make sure I am not over trading.

As many of you know I mostly use 1 hr charts for my overbought and oversold trades, and I also look at the 1 day charts to see if there is any price resistance in the area that I should be aware of before entering. This goes right along with my idea that the longer the time frame, the more pairs you can trade.

Advice for new traders trying to decide which pairs to trade

My personal trading experiences were with every currency pair. In the beginning I think new traders should learn as much as they can about every pair. As you build a trading style that is consistent, you will learn that there are certain pairs that just don't play nice with your trading goals. I have only recently even strarted looking at scalping in my trading, and this is after years of trading much longer time frames. I am now concentrating on a couple of the majors with low spreads for short scalps, but really never more than one at a time to avoid hasty trades and confusion.

And I don't think I even have to say that new traders should not be trying any of these strategies with real money. It's much better to lose all of the money in a demo account a couple of times, than it is to try to tell your wife where all of that money went. Learn from listening to other traders, trade on demo, become humble, then start your journey. You'll thank me later.

NZ-USD Trade Archieves

Published on: Kamis, 06 Februari 2014 in , ,
5M is small TF, the curve ( Turning Point area is very clear ) it's Not Bad during US Session..( Intraday )


GBP-AUD Trade Review

Published on: Senin, 03 Februari 2014 in , ,
This is the analysis before, look at the picture for the POUND-AUSSIE (GBP-AUD), and today it goes to 1.8536x...Gonna be a long journey..??? let see :D


                                           GBP/AUD :Monday Feb-03-2014

This is just a sample Basic Trade: use/make analysis/Read the Price Action with LR_TSF, and the levels, remember the more hugging is more stronger, and read all the levels also to determine the PA movements...


Success Guys..

Best Regards

QAS30

The 77 Year Old Chart Pattern

Published on: Minggu, 02 Februari 2014 in , ,
Article Summary: A leading technical analyst of the 1930s created a method for trading that is still applicable today. Learn how to trade market turning points based on Fibonacci retracements and market psychology with the Gartley Pattern.
Many traders ask how a trading method that is 77 years old is applicable today. When you combine timeless tools like Fibonacci Retracements with great risk: reward ratios, it’s easy to see why this method is so popular. If those aspects of a trading method appeal to you, it’s my pleasure to introduce you to the Gartley chart pattern.
 
What is the Gartley Pattern?
The Gartley pattern is a powerful and multi-rule based trade set-up that takes advantage of exhaustion in the market and provides great risk: reward ratios. The pattern is also known as the “Gartley 222” because the pattern originated from page 222 of H.M. Gartley’s book, Profits in the Stock Market that was published in 1935 and reportedly sold for $1,500 at the time.
The Gartley pattern is based on major turning points or fractals in the market. This pattern plays on trend reversal exhaustion and can be applied to the time frame of your choosing. The other key that makes this pattern unique are the crucial Fibonacci retracements that come together to fulfill the plan.
There is a bullish / long / buying pattern and an equally powerful bearish / short / selling pattern. Much like you would find with a head and shoulders pattern you buy or sell based on the fulfillment of the set up.
Learn Forex: Buy & Sell Gartley Chart Pattern
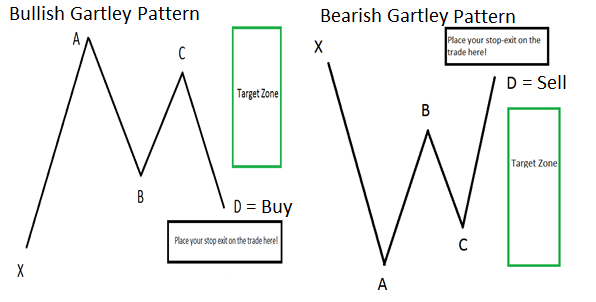
 
Learn_Forex_The_87_Year_Old_Chart_Pattern_That_Traders_Still_Love_body_Picture_6.png, Learn Forex: The 77 Year Old Chart Pattern That Traders Still Love
Here is a stripped down version of patterns so you can see what the look like without price and time on the chart.
The buy pattern will always look like an "M" with an elongated front let. The sell pattern will always look like a "W" with an elongated front leg. 

Gartley Strategy Tools 
 
The three important tools to use on your chart when finding a Gartley are:
Fractals - The important part about trading the Gartley pattern is that you will trace the pattern from turning points or swings in the market. One of the better indicators to trace swings is Fractals. Fractals show up as arrow above swings in price.
 
Fibonacci Retracements – The Fibonacci retracements will make or break the patterns validity. Below are the specific retracements that make up the pattern. Fibonacci retracement lines are horizontal lines that display support or resistance in a move.
Add Line Tool (Optional) – This tool will allow you to clearly draw connecting points like X to A, A to B, B to C, and C to D for easy measuring. 
 
Gartley Strategy Rules
  • Point B should retrace 0.618 from the XA move.
  • Point D should retrace 0.786 from the XA move and create the entry zone.
  • Point D should be a 1.27 or 1.618 extension of the BC move
  • Point C should retrace anywhere from 0.382 – 0.886 of the AB move.
  • Buy or Sell at point D depending on whether the pattern is bullish or bearish
  • Place stop either below the entry for the tightest or Risk: reward ratio or below Point X.
  • If the market trades through Point X, the Gartley pattern is invalid and you should exit or not take the trade.
When these rules are met, you can find yourself on the cusp of a trade at the Entry Zone. Recognizing these points in the market is truly like riding a bike. Once you get the hang of it, the levels will pop out on the chart to you.
The EURNZD set up an ideal Bearish Gartley Pattern leading into the Reserve Bank of New Zealand Interest Rate Announcement.
Learn Forex: EURNZD chart where Bearish Gartley played out
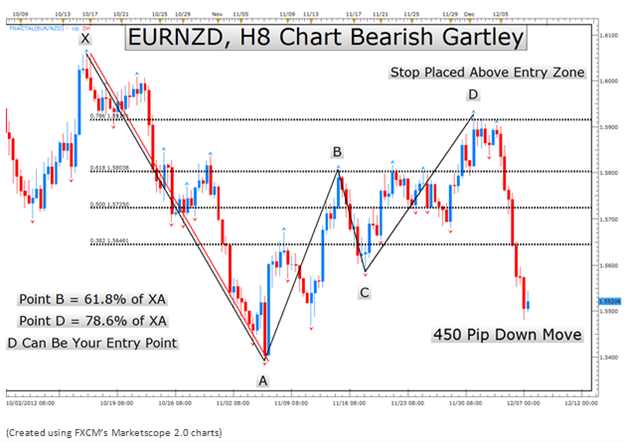
Learn_Forex_The_87_Year_Old_Chart_Pattern_That_Traders_Still_Love_body_Picture_7.png, Learn Forex: The 77 Year Old Chart Pattern That Traders Still Love
Another set up is forming on the EURJPY and has begun to play out. If you liked the set up, you could sell at Point D and place a stop above point X. Point X is the start of the pattern and is an extreme point on the chart.
Learn Forex: EURJPY chart where Bearish Gartley is forming
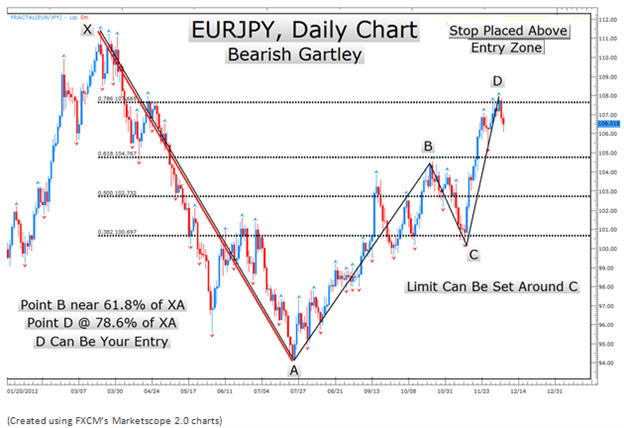
Learn_Forex_The_87_Year_Old_Chart_Pattern_That_Traders_Still_Love_body_Picture_8.png, Learn Forex: The 77 Year Old Chart Pattern That Traders Still Love
Closing Tips on Using This Pattern
When trading the Gartley pattern, the pattern is meant to be traded at D only. If you believe a pattern is unfolding but we’re only at point B, be patient and hold off until we get to D. The power of the pattern comes from converging Fibonacci levels of all points from X to D and using the completed pattern for well-defined risk.
Lastly, this can be traded on any time frame you prefer. The reason this method has a stable track record is that it is based on unusual market positions where most traders are afraid to enter. Take advantage of the risk: reward set up available and trade with proper trade size.
This pattern occurs rather frequently. When you get comfortable with using Fibonacci retracements for support and resistance you'll find yourself looking for the points to complete a Gartley pattern. It is very important to watch for the D point to be at 78.6% of the XA leg and to keep your stops rather tight in case the pattern is invalidated.

Happy Trading!
---Written by Tyler Yell, Trading Instructor
To contact Tyler, email tyell@fxcm.com.
To be added to Tyler’s e-mail distribution list, please click here.
Unsure which indicators match up with your skill set?

Analisa EUR-USD

Published on: Sabtu, 01 Februari 2014 in , ,
  A week ago EUR/USD stayed at 1.3688 and now about 1.3487, the trend is clear enough if the down ward is still strong in Weekly Time Frame. More Hugging gonna more stronger..no matter when the PA touch the Limit Area ( Like Bollinger Band ).

EUR_USD Now :


MACD Simple Trade

Published on: Senin, 11 November 2013 in , ,
It's a very simple trade by using MACD, no peak or bottom positions, because we just follow the trend.

for the MACD I love to use : 30-60-30 (15M), and other settings..

                                                         QAS30_MACD_TRADE
                                                         sample Trade for EUR/USD

Turning Point Area and How strong the trend is

Published on: Kamis, 07 November 2013 in , ,
It was earlier in the morning, I wrote the sample for EUR/USD and now :


This is just a sample how to make an analysis by using LR_TSF, when the Trend is really strong talking none can't stop it.

Without TSF of course we may use Linear Regression it's self, but it will be different when we put both together.."Forecasting" That's the key..the more simple on your chart the most easier for us, we don't need dozen of visual indicators to make an analysis.

success guys

Update:
 =======
My GBP/JPY Trade :


M1 Trade Technique

Published on: Sabtu, 23 Maret 2013 in , , ,
This is just an archieves of My Trades, I do believe there is corrections on the smallest TF M1:

It's not an easy thing to Trade on M1, cause everything must be on the same point.."Greed when other people getting fear and fear when other people gonnna be Greedy"


Ps: I can close all my orders manually without waitng to Hit my Target when i got enough i fell enough.because market is open for 24 hours in 5 days,..there is a lot of chances...

Trade Like A sniper : M1 Trade

Published on: Selasa, 19 Maret 2013 in ,
M1 trade sample:


Trade Like a Sniper. Koreksi terkecil yang ada di chart ya M1, pola bentukan koreksi awal sekali akan ada di M1, butuh extra kehati2an dalam Trade di TF terkecil ini, pola koreksi walau akan terjadi tetap pembacaan Trend terjauh wajib dilakukan.

Kenapa...?? karena seburuk2 trade jika tidak melawan trend terjauh tidak akan jelek hasilnya, pemanfaatan M1 sebagai pola area koreksi dimanfaatkan semaximal mungkin untuk area re entry.

Perpotongan MA bukan merupakan basic Trade saya dalam M1, retrace koreksi dalam batasan - batasan di M1 yang betul - betul saya manfaatkan, kasarnya begini : " Toh saya bisa trade and Run Anytime, kemudian saya sudah bisa profit duluan dibandingkan mereka yang trade berbasic MA dengan menunggu MA cross".

Profit bisa saya bawa/closed kapan saja nyentuh atau tidak sentuh TP saya, karena memang yang saya ambil hanya M1.

sukses.

Read The Price Action Is The Way For Successfully Trader

Published on: Kamis, 14 Maret 2013 in ,


To successfully trade Price Action a trader must be able to identify if a market is trending or ranging. Once this has been assessed clear levels for support or resistance must be marked for possible setups to trade either long or short.

Identifying the Trend

Technical traders use can use many different tools to identify the trend such as moving averages, however the best tool the trader has at their disposal is their eyes. After much experience and chart time a trader begins to get a feel for how a market is unfolding and moving.
When learning to identify trends it is always best to start on the larger time frames such as the daily charts. These larger time frames hold the key to all the big moves in the market. The chart below shows the daily chart of the EURUSD which is in a very obvious down trend.

chart1 2/19/12


Trading with the trend in your favour is always the best course of action. Often you will hear that “the trend is your friend” and this is very true. The reason for this is that the overall trend normally continues until some sort of major support or resistance in the market is hit, or a large fundamental change in one of the economies involved occurs. A pattern in the market that may signal a trend is under way is known as the “1,2,3 pattern”. This pattern is made up of 3 legs of price movement. For a bearish trend the pattern is made up of;
1. Price falls lower
2. Price retraces and creates lower high
3. Price falls lower again and creates a new lower low

In the chart below we have an example of this pattern. We can see that price first went lower before then retracing and creating a lower high. The pattern was then confirmed when price went lower and created a lower low.


chart2 2/19/12


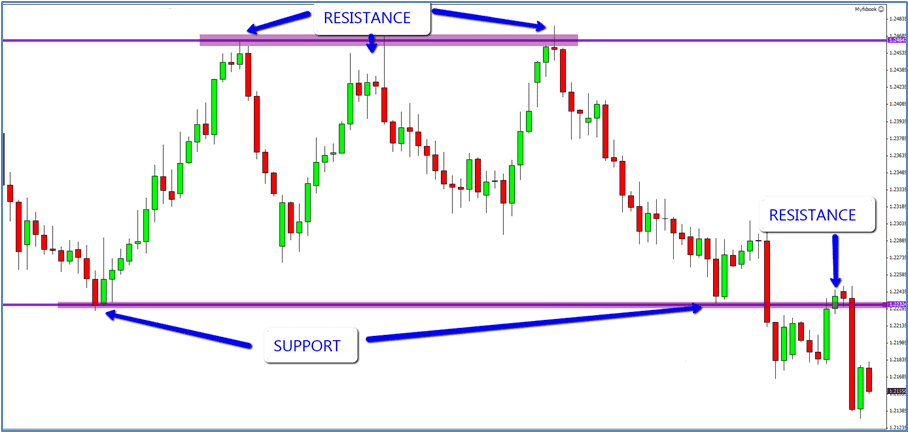
Marking Support and Resistance Support and resistance is a very important part of the Forex market. Price will often bounce or move away from support or resistance so learning how to mark these levels correctly is critical.
To mark support and resistance we need to mark the most obvious levels on the larger time frames charts such as the 1 day chart. The levels we plot on the daily chart will guide us when trading on the intraday charts such as the 4hr and 1hr.
Below is a chart of the daily EURAUD. Only the very clear and obvious levels have been marked. Take note just how closely price respects these areas.


chart3 2.19.12


Waiting For Price to Reach Key Levels
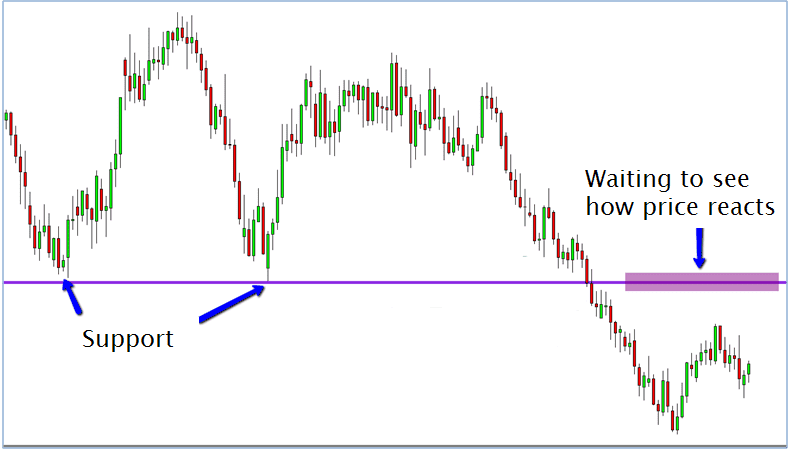
Once support and resistance levels have been marked clearly on a chart, the next job of a Price Action trader is to watch and wait for price to reach these important levels in the market. Price Action gives clues all the time as to what direction it is looking to trade in.
Traders should pay particular attention to what price does when it reaches the support and resistance levels and whether price rejects these levels or breaks out. Traders all over the world are watching these levels and watching for trading opportunities.
The following chart shows an example of an area that traders would be watching and waiting for price to reach.

chart4 2/19/12


Matching Price Action Setups with Support and Resistance Once traders have worked out the strength and direction of the trend and also identified the key places in the market they would like to enter, they then need to learn to trade Price Action signals from these key areas.
Examples of powerful Price Action signals are;
The Pin Bar Reversal
The Engulfing Bar
The 2 Bar Reversal

Traders can learn the ins and outs of how to trade Price Action signals through a course such as Forex School Online’s Advanced Price Action Course
To successfully trade Price Action setups traders will need to learn everything about the setups, including how to enter, how place stops and how to correctly manage trades once they are in them.

Putting it All Together

Trading with as many factors in your favour is going to increase the chance of placing a winning trade. Smart traders try to trade with as much confluence as they possibly can. When looking to trade Price Action signals try to trade with;
The trend in your favour
From key levels in the market
Reliable and proven Price Action signals

Trading Price Action does not need to be a made complicated. The traders that usually turn out to be the successful Price Action traders always look to trade with as many market factors in their favour as they can.

Mencari titik terbaik entry

Published on: Rabu, 13 Maret 2013 in ,
Titik terbaik entry sangat diperlukan untuk intraday, sebetulnya tidak hanya untuk intraday trade swingpun demikian, cuman pasti ada perbedaan, swing misalkan analisa TF D1-W1-MN1 lalu entry, atur MM, set target, SL, tinggalin, tidak perlu menunggu konfirmasi lagi di TF kecil, perkara harga akan koreksi dulu sebelum lanjut trend TF besar cenderung diabaikan, TP pun jauh, buka chart lagi check posisi tersebut 2-3 hari lagi, atau mungkin 1-2 minggu lagi bahkan 1-2 bulan kemudian atau mungkin juga tahun depan, Trade gak perlu ditungguiin sampai nongkrong depan PC lama-lama, umumnya swinger adalah trader yang memang "lebih mengarah pada investasi" atau punya aktifitas lain disamping Trade,bukan menjadikan Trade sebagai mata pencarian pokoknya dia.

Fulltime trader kan gak begitu, waktu terbaik untuk masuk ke pasar betul-betul ditunggu, entry gak bisa ngehold floating minus banyak-banyak sebelum kena target, bahkan op pun bisa di closed manually, sebelum kena target "setelah merasa cukup" atau ada analisa lainnya.

"Harga gak pernah bergerak lurus seperti sebuah garis" walau TF D1 misalnya confirm UPward, tetep saja akan ada koreksi - koreksi di bawah TF D1 tersebut, dan koreksi terkecil adalah TF M1 ( 1 menit ) :D,  maka saya memanfaatkan koreksi yang terjadi di TF terkecil tersebut dalam intraday saya, saya cari moment terbaik dan hanya entry ketika segalanya confirm secara technical saya.

10-20 pips juga kalau sering mah jadinya kan banyak :)


Sukses..

Wassalam

Analisa AUD/USD

 1. PA pullback dari 72 nya Monthly, belum sanggup menembus 72 MN1.

2. W1 TF, belum ada perenggangan pada LR_TSF, walau PA sudah ada di area LR_TSF, namun tekanan sar W1 diatas masih bisa mendorong PA ke arah sar di bawahnya, jalan di W1 sudah terbuka dengan breaknya sar tersebut buat PA melanjutkan Trend W1.

3. H1 merupakan area entry ( intraday ) dan re entry ( swing trade )


H1 TF yang merupakan koreksi dari D1 TF , dengan membaca/melakukan analisa pada W1, bisa dijadikan asumsi untuk entry/trade, namun pada dasarnya Trade harus membaca trend, semua TF harus dianalisa, dikondisikan, mulailah dengan TF terbesar, ambil asumsi risk dan rewardnya, sesuaikan dengan style trade, intraday atau swing trade. Baca pula korelasinya, untuk hasil maximal.


PS: "closed manual jika merasa cukup"

semoga berguna..


Subscribe to our RSS Feed! Follow us on Facebook! Follow us on Twitter!