qas30

--== It is Not Random But Designs ==--
Having trading discipline is the beginning; keeping discipline is the progress;
staying discipline is the success

NZD-USD Trade Archieves

Published on: Minggu, 03 Agustus 2014 in ,
Long term, doesn.t need a lot of time to sit infront of our pc, control the margin, set target, and leave it, of course. it is smaller than intraday trade but no stress at all and a lot of fun, for my self  i do this way for my investment i just put 2-5% of my margin, that's all.

Long long time periods, i just open/control it once in a weeks or twice in a month...for sure to cover my daily expenses i have my own intraday trade acc with a very different trade style.


Gold Trade Archieves

Published on: Senin, 17 Februari 2014 in , ,


Following W1TF  analysis,...when the they make a curve..PA can break 36 area now, LR_TSF are still hugging, gonna be higher move forward to 72 level area..i can closed it manually or let it run..i will control D1 TF as my long term trade correction area.

No Funda at all thi is just a Technical Trade analysis.


NZ-USD Trade Archieves

Published on: Kamis, 06 Februari 2014 in , ,
5M is small TF, the curve ( Turning Point area is very clear ) it's Not Bad during US Session..( Intraday )


GBP-AUD Trade Analysis and Review Part 3

Published on: Selasa, 04 Februari 2014 in ,
The first 1 was here,  then this is the second's one,...and today :

                                          GBP-AUD LR_TSF Trade Analysis Part3 Feb-4-2014

I Closed The first entry already/ the top one ( Manually ), I got enough..and i'll let one position for my long trip, during Intraday i just follow the big map , i won't go long ( fighting my big map ).
 

sample result (today) :

                                          GBP-AUD Trade Result ( Feb-4-2014 )

all is the sample with my live account, i know you got own way, for my self i made big map and always trade and stick with it, no matter what. And For Sure I will always take a  look ( Control ) the Correlations :


                                           AUD-USD-Trade archieves ( feb-4-2014)
No Matter What's is your trade system, knowing the trend, how's strong the trend, and turning point area is very important.


Success guys


Regards

QAS30

GBP-AUD Trade Review

Published on: Senin, 03 Februari 2014 in , ,
This is the analysis before, look at the picture for the POUND-AUSSIE (GBP-AUD), and today it goes to 1.8536x...Gonna be a long journey..??? let see :D


                                           GBP/AUD :Monday Feb-03-2014

This is just a sample Basic Trade: use/make analysis/Read the Price Action with LR_TSF, and the levels, remember the more hugging is more stronger, and read all the levels also to determine the PA movements...


Success Guys..

Best Regards

QAS30

Analisa EUR-USD

Published on: Sabtu, 01 Februari 2014 in , ,
  A week ago EUR/USD stayed at 1.3688 and now about 1.3487, the trend is clear enough if the down ward is still strong in Weekly Time Frame. More Hugging gonna more stronger..no matter when the PA touch the Limit Area ( Like Bollinger Band ).

EUR_USD Now :


Linear Regression And Time Series Forecast Trading Strategy ( LR_TSF)

Published on: Kamis, 30 Januari 2014 in , ,


Basically it was created by Fx Lion, Then I made some modifications by adding the T3 Levels and Linear Regreassion, to read the PA movements by reading the LR_TSF and T3 Levels, so we can read the forecast not only from LR_TSF but we have to understand the T3 levels it self.

First reaction comes from LR_TSF, then the T3 Level functions,  there is reactions ( almost whole the times ) when PA goes to every single leves. I wrote the tutorials and how to use it here ( sorry it's in my native language Indonesian ) and it's free to download the System and Template.

I have been using this strategy long enough and it's always on my chart to make PA analysis. for my self i don't use it much at the small TF, but we can use it anyway, Combine with your strategy that's fine..and knowing The turning Point area and how strong the trend is important.

It's Credited To Jhon Bysu also, thank's brother for the indicator modifications. ( a lot Of memories right :D )

I don't have no more  activities right there ( Forum ).

Read How To use it, Try it On demo and probably if you are not Indonesian use Google translate :D

Good Luck and Success

Best Regards

QAS30


EUR/USD Trade Analysis..It's Repeat It Self..??

Published on: Jumat, 24 Januari 2014 in ,
It was about Jul 14, 2011 3:35pm look at the picture, after that EUR/USD moved down to 1.217x and now..( January 24-2014 ) :

Compare it..Very interesting right..:D

 Not Bad for this week end :


                                       @copyright qas30 trade archieves January 2014


Batas Dan Arah Pergerakan Harga

Published on: Sabtu, 30 November 2013 in , ,
Kenapa Batas..??? bukan Arah terlebih dahulu..??? Batas merupakan hal terpenting yang wajib diketahui oleh setiap retailer, trader atau investor, Dan akurasi akurasi batas-batas itulah yang akan dicari cari oleh setiap trader, dari Mulai Time Frame terbesar di Chart MH1 hingga TF terkecil M1.

Dalam Setiap TF tersebut akan ada hukum-hukumnya yang mengharuskan si harga terkoreksi setelah dia berada dalam area kesepakatan batas batas di setiap TF tersebut. Maka dari itu Time Frame Tradepun terbagi ke beberapa TF, kenapa coba tidak hanya MH1 Chart..?? atau M1 chart saja ada M5,M30,H1,H4,D1,W1, ya karena ada batas dan hukum dalam setiap TF-TF tersebut. misalkan, Trend terbesar MH1 misalnya, setelah di analisa harga akan bergerak naik, namun jika D1 nya sudah ada dalam batas - batas atas maka bisa dipastikan akan ada Koreksi, sebelum melanjutkan kembali Trend terbesarnya.

Saya Misalkan begini: Kereta Api Parahyangan tujuan Bandung - Surabaya. ( merupakan tujuan akhir/Trend ) jelas di situ akan berangkat dari Bandung ke Surabaya, Batasnya ya Stasion Bandung Gubeng Surabaya.

                                                  Contoh : melihat batas Pergerakan


                                                    Contoh: Trend Sepakat basic MA


Di dalam perjalanannya, dia akan berhenti di Malang, Yogya, dsb, nurunin penumpang yang memang tujuannya hanya sampai malang, atau kota lainnya, lalu naikin lagi penumpang yang akan ke Surabaya juga, masinis bisa saja ganti, isi kembali akomodasi/logistik buat restorka, dll, baru lanjut lagi hingga akhirnya sampai ke Surabaya sebagai tujuan akhir.

Trendpun demikian, setelah kita tahu batas di mana dia akan berheti dulu, kapan lanjut kembali dsb, yang kita butuhkan hanya ikutin saja, kalau memang stop dulu di H1 misalnya, toh pasti setelah H1 selesai dia akan lanjutkan kembali trend di atasnya, ya jangan di lawan.

Arah pergerakan, misalkan menggunakan pola MA dan hampir semua visual indicators menggunakan basic MA, dengan type-typenya, bagi saya pribadi hanya sebagai pemasti saja, kenapa..??? saya misalkan begini, si MA cross UP atau cross down, namun dia bisa saja tiba - tiba bengkok seketika, dan berbalik arah,..."wow ada pelaku pasar gede nih yang masuk"...he he he...padahal harga sudah ada dalam batas kesepakatan untuk koreksi dalam sebuah TF ya koreksi dan MA tersebutpun bengkok tiba-tiba.

Mereka pelaku pasar gede diluar sanapun akan patuh pada batas-batas harga, control dari Bank centralpun berlaku, ketika harga sudah sepakat dalam area batas-batas, karena menyangkut pada stabilitas perekonomian satu negara, hedge and fund, instuisi, atau para seniman pasar ( yang biasa orang bilang spekulan ) akan selalu memperhitungkan batas batas area tersebut....


Good Luck..

AUD_USD Trade Archieves

Published on: Kamis, 14 November 2013 in ,
I am only a passanger, i am nothing, so just keep going all the way with them :

                                          @qas30 AUD_USD_Trade_Archieves


NZ-USD During NFP

Published on: Jumat, 08 November 2013 in ,
NZ/USD Trade Archieves during NFP:


                                                       NZ/USD TRADE ARCHIEVES
                                                        AGEA NZ/USD TRADE ARCHIEVES
                                                    
                                                                Lovely GBP/USD


Got the the system. with some tutorial ( Indonesian Language ) and template here

it's Credited for Jhon Bysu

Turning Point Area and How strong the trend is

Published on: Kamis, 07 November 2013 in , ,
It was earlier in the morning, I wrote the sample for EUR/USD and now :


This is just a sample how to make an analysis by using LR_TSF, when the Trend is really strong talking none can't stop it.

Without TSF of course we may use Linear Regression it's self, but it will be different when we put both together.."Forecasting" That's the key..the more simple on your chart the most easier for us, we don't need dozen of visual indicators to make an analysis.

success guys

Update:
 =======
My GBP/JPY Trade :


Time Series Forecast (TSF)

Published on: in
TSF, the Time Series Forecast indicator, consists of linear regression measurements using the Least Squares method. Linear regression is a statistical tool for forecasting future Forex market values comparing to past values. TSF tries to forecast the following Forex market value. For that purpose, it defines the trend's upward or downward declivity and stretches those results into the future. For instance, when prices are moving upwards, TSF tries to define the upward declivity of the price compared to the ongoing price and stretch that calculation forward.

The trend is considered down when the Forex market price falls below the indicator, the Trend is considered up when the Forex market price rises over the indicator. Besides, a lot of analysts think that once prices shift above or fall below the indicator line; prices will likely move back to the line. The TSF indicator also defines if a change in direction happened monitoring the ongoing trend.

The Time Series Forecast indicator resembles the Linear Regression indicator with the exception of two important distinctions. One distinction is the default Length input value used for the TSF is much shorter because the plot line is stretched forward. Another distinction is that TSF plots its line forward, to the right of the chart, by the number of bars specified by the Bars Plus input. A larger Length input would not be as trustworthy as a shorter-term length while analyzing price activity and trends and would form a considerably exaggerated plot.

 Read More here


                                           a. EUR/USD with Linear Regression


                                         b. EUR/USD with TSF


c. EUR/USD Clearly with Linear Regression and TSF


Take a look when They are Hugging, and make a clue/curve as the turning point area.

Sample Live Trade with AUD/USD :


Linear Regression is a statistical tool used to predict future values from past values.  By using the least squares method, a straight line can be plotted that minimizes the distance between the resulting line and the data set in order to reveal a trend. - See more at: http://etfhq.com/blog/2010/11/06/linear-regression-indicator-time-series-forecast/#sthash.1VxgvU2g.dpuf

What Is Linear Regression

Published on: in

Linear Regression

Linear regression attempts to model the relationship between two variables by fitting a linear equation to observed data. One variable is considered to be an explanatory variable, and the other is considered to be a dependent variable. For example, a modeler might want to relate the weights of individuals to their heights using a linear regression model. Before attempting to fit a linear model to observed data, a modeler should first determine whether or not there is a relationship between the variables of interest. This does not necessarily imply that one variable causes the other (for example, higher SAT scores do not cause higher college grades), but that there is some significant association between the two variables. A scatterplot can be a helpful tool in determining the strength of the relationship between two variables. If there appears to be no association between the proposed explanatory and dependent variables (i.e., the scatterplot does not indicate any increasing or decreasing trends), then fitting a linear regression model to the data probably will not provide a useful model. A valuable numerical measure of association between two variables is the correlation coefficient, which is a value between -1 and 1 indicating the strength of the association of the observed data for the two variables.
A linear regression line has an equation of the form Y = a + bX, where X is the explanatory variable and Y is the dependent variable. The slope of the line is b, and a is the intercept (the value of y when x = 0).

Least-Squares Regression

The most common method for fitting a regression line is the method of least-squares. This method calculates the best-fitting line for the observed data by minimizing the sum of the squares of the vertical deviations from each data point to the line (if a point lies on the fitted line exactly, then its vertical deviation is 0). Because the deviations are first squared, then summed, there are no cancellations between positive and negative values.

Example

The dataset "Televisions, Physicians, and Life Expectancy" contains, among other variables, the number of people per television set and the number of people per physician for 40 countries. Since both variables probably reflect the level of wealth in each country, it is reasonable to assume that there is some positive association between them. After removing 8 countries with missing values from the dataset, the remaining 32 countries have a correlation coefficient of 0.852 for number of people per television set and number of people per physician. The value is 0.726 (the square of the correlation coefficient), indicating that 72.6% of the variation in one variable may be explained by the other. (Note: see correlation for more detail.) Suppose we choose to consider number of people per television set as the explanatory variable, and number of people per physician as the dependent variable. Using the MINITAB "REGRESS" command gives the following results:
The regression equation is People.Phys. = 1019 + 56.2 People.Tel.
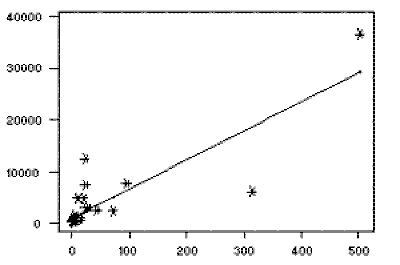
To view the fit of the model to the observed data, one may plot the computed regression line over the actual data points to evaluate the results. For this example, the plot appears to the right, with number of individuals per television set (the explanatory variable) on the x-axis and number of individuals per physician (the dependent variable) on the y-axis. While most of the data points are clustered towards the lower left corner of the plot (indicating relatively few individuals per television set and per physician), there are a few points which lie far away from the main cluster of the data. These points are known as outliers, and depending on their location may have a major impact on the regression line (see below).

Data source: The World Almanac and Book of Facts 1993 (1993), New York: Pharos Books. Dataset available through the JSE Dataset Archive.

Outliers and Influential Observations

After a regression line has been computed for a group of data, a point which lies far from the line (and thus has a large residual value) is known as an outlier. Such points may represent erroneous data, or may indicate a poorly fitting regression line. If a point lies far from the other data in the horizontal direction, it is known as an influential observation. The reason for this distinction is that these points have may have a significant impact on the slope of the regression line. Notice, in the above example, the effect of removing the observation in the upper right corner of the plot: With this influential observation removed, the regression equation is now
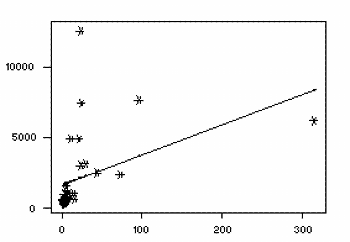
 People.Phys = 1650 + 21.3 People.Tel. 
The correlation between the two variables has dropped to 0.427, which reduces the value to 0.182. With this influential observation removed, less that 20% of the variation in number of people per physician may be explained by the number of people per television. Influential observations are also visible in the new model, and their impact should also be investigated.


Residuals
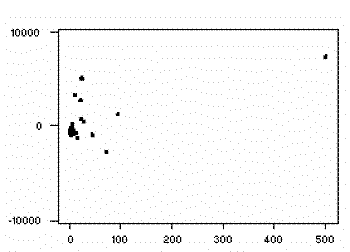
Once a regression model has been fit to a group of data, examination of the residuals (the deviations from the fitted line to the observed values) allows the modeler to investigate the validity of his or her assumption that a linear relationship exists. Plotting the residuals on the y-axis against the explanatory variable on the x-axis reveals any possible non-linear relationship among the variables, or might alert the modeler to investigate lurking variables. In our example, the residual plot amplifies the presence of outliers.

Lurking Variables

If non-linear trends are visible in the relationship between an explanatory and dependent variable, there may be other influential variables to consider. A lurking variable exists when the relationship between two variables is significantly affected by the presence of a third variable which has not been included in the modeling effort. Since such a variable might be a factor of time (for example, the effect of political or economic cycles), a time series plot of the data is often a useful tool in identifying the presence of lurking variables.

Extrapolation

Whenever a linear regression model is fit to a group of data, the range of the data should be carefully observed. Attempting to use a regression equation to predict values outside of this range is often inappropriate, and may yield incredible answers. This practice is known as extrapolation. Consider, for example, a linear model which relates weight gain to age for young children. Applying such a model to adults, or even teenagers, would be absurd, since the relationship between age and weight gain is not consistent for all age groups.

M1 LR_TSF

Published on: Rabu, 06 November 2013 in ,
It.s working for scalp by reading every single levels :


                                M1 LR_TSF

Just an Archieve

Published on: Minggu, 03 November 2013 in ,
AGEA atau dulu dikenal dengan Marketiva, dengan platformnya tersendiri, banyak keunikan didalamnya yang memang tidak semirip MT4/5, dengan segala limitasi dan kesederhanaannya namun jika di gali seserius mungkin banyak hal di dalam kesederhanaan dan keterbatasannya tsb yang bisa di visualkan sebagai acuan dasar analisa trade.

Lumayan lama beberapa visual indikatornya saya jadikan bahan dasar analisa trade, bahkan seringnya di MT4 saya kosongkan, hanya menyimpan indikator tertentu saja profit loss info misalnya, karena bahan dasar penganalisaan saya lakukan di AGEA ini.

Pernah terbesit ketakutan "bagaimana yah, kalau AGEA ini ganti platform.." Alhamdulilah sedikit demi sedikit, mulai ada yang bisa divisualkan di MT4/5 dengan mendekati "mirip" yang saya inginkan seperti halnya yang biasa dijadikan sebagai bahan dasar acuan analisa Trade saya pribadi di AGEA.

Memang banyak yang unik dari AGEA ini..


                                          Intraday HI-LO-Basic AGEA Concept


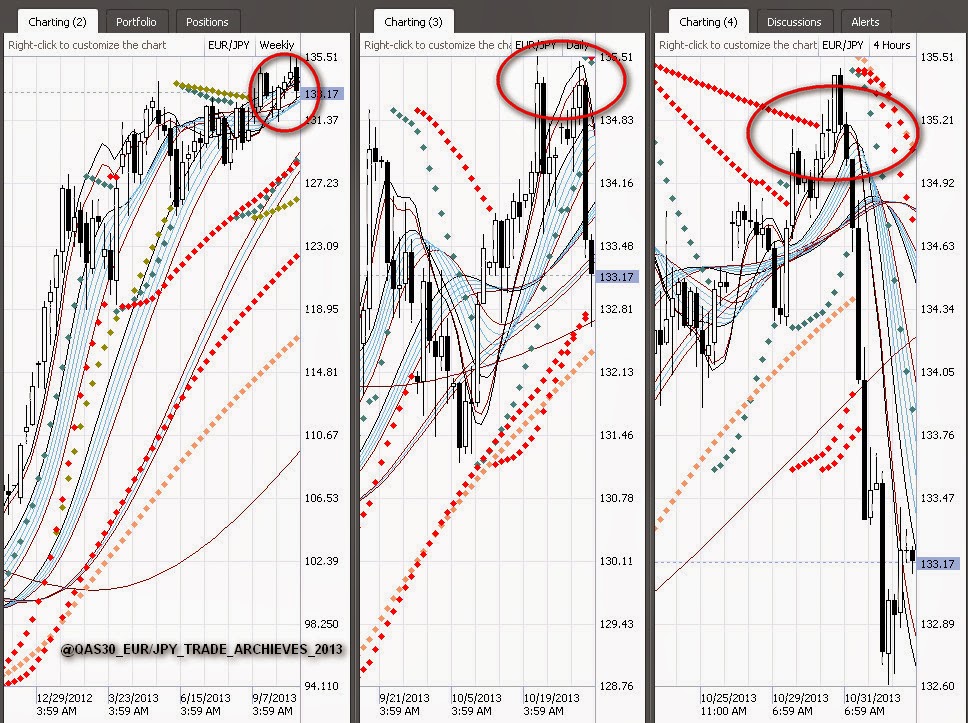
                                          EUR/JPY Trade Archieves


                                         EUR/USD Trade Archieves


Do Your Own Trade Style

Published on: Minggu, 21 Juli 2013 in ,

Pola/Style Trade tiap Individu adalah beda, masing2 retailer mempunyai karakter tersendiri dalam investasi mereka, ada yang suka intraday saja, scalping atau long term trade, Masing masing style punya punya kelebihan sendiri sendiri, umumnya style trade sejalan dengan karakter si individu ( trader ) tersebut, yang suka intraday gak bisa nge judge ke long term trader " wah Op bulukan kapan opitnya"


Long Term Traderpun gak bisa sinis pada intraday trader " opit 30 pips saja sudah mabur", toh tujuan akhirnya sama yaitu " Profit Oriented" dengan segala risk rationya dalam masing - masing style. Seorang Trader yang merasa nyaman dengan swing trade tentunya sudah memperhitungkan segala risk dan reward rationya, pun halnya seorang intraday trade. Walau akan ada beda kedepannya ( secara phsycology ) antara investor yang biasa menerapkan "jumlah pips yang didapat sebagai acuan ( Trade lebih focus pada pola investasi ), dengan trader yang terbiasa mencari banyaknya $ dalam setiap kali tradenya".

"Ane doyan bau juga rasa buah durian blom tentu ente atau yang lainnya"

Intinya "Just Do Your Own when U fell it's the right thing for ur self". Kasarannya gua, lahir tanpa ente kok, matipun gak ditemenin ente, selama itu bagus buat kita dalam trade "just do it"

Prinsip ane pribadi sih " I don't need To Trade Often but I have to trade Right"

Trade Review

Published on: Selasa, 25 Juni 2013 in ,
4-5 Bulanan yang lalu analisa di lakukan di AUD/USD, alhamdulilah harga sekarang running di 0.92xx, entry sell waktu itu di 1.03xx an...
 Swing Trade memang tidak seperti intraday trading, pengaturan margin, tehnik, serta psychology nya jelas berbeda, ada kepuasan tersendiri dalam swing trade di mana analisa yang dilakukan tepat, poin yang didapat pun banyak, bukan jumlah $$ nya namun hasil poin yg di dapat tersebut, toh si $$ akan nyusul dengan sendirinya seiring kekuatan margin kita.

Kemudian yang terutama akan ada keyakinan pada Trade kita, berdasarkan hasil analisa trade kita, hmmm untuk AUD/USD masih ada kemungkinan ke bawah lagi namun saya sudah merasa cukup, ya cukup batasan saya di angka - angka yang saya pribadi rasakan cukup.

Memahami jumlah pips/poin yang di dapat dalam trade kedepannya akan sangat terasa sekali, karena pola yang kita lakukan adalah investasi ( dengan diatur sedemikian rupa/ seaman mungkin MM dsb ). memang kecil sih..untuk kadar trade ( jika di bandingkan dengan mereka yang jago - jago di sana ada yang bikin ribuan percent dalam 1 bulan ).

Yang saya lakukan dalam swing Trade adalah investasi, saya trade hanya 2-2,5% dari margin, ya alhamdulilah setidaknya masih di atas hasil deposito di Bank, dan tradepun gak ngos-ngosan, tanpa perlu melototin chart tiap hari dalam swing trade saya. Mentalpun akan terlatih untuk yakin pada system dan analisa dengan berani meninggalkan posisi, serta tidak gatel tangen entry dan re entry apalagi averaging atau marti trade.

Ada juga sekali kali saya melakukan intraday Trade dalam account yang memang saya siapkan untuk hanya intraday Trade saja, ketika saya punya cukup waktu untuk melakukan intraday Trade, namun tetap saya akan berusaha mengontrol emosi saya untuk tetap berpijak pada pola investasi, walau itu dalam Intraday Trade, karena Money Management adalah kunci ( bagi saya ), di samping tehnik trade  untuk bisa survive dalam bisnis ini.

Analisa AUD/USD

Published on: Rabu, 13 Maret 2013 in , , ,
 1. PA pullback dari 72 nya Monthly, belum sanggup menembus 72 MN1.

2. W1 TF, belum ada perenggangan pada LR_TSF, walau PA sudah ada di area LR_TSF, namun tekanan sar W1 diatas masih bisa mendorong PA ke arah sar di bawahnya, jalan di W1 sudah terbuka dengan breaknya sar tersebut buat PA melanjutkan Trend W1.

3. H1 merupakan area entry ( intraday ) dan re entry ( swing trade )


H1 TF yang merupakan koreksi dari D1 TF , dengan membaca/melakukan analisa pada W1, bisa dijadikan asumsi untuk entry/trade, namun pada dasarnya Trade harus membaca trend, semua TF harus dianalisa, dikondisikan, mulailah dengan TF terbesar, ambil asumsi risk dan rewardnya, sesuaikan dengan style trade, intraday atau swing trade. Baca pula korelasinya, untuk hasil maximal.


PS: "closed manual jika merasa cukup"

semoga berguna..


Subscribe to our RSS Feed! Follow us on Facebook! Follow us on Twitter!